Debunking Huebner's 'A Possible Declining Trend for Worldwide Innovation'
Replicating Huebner's methodology with historical figures reveals no innovation decline—apparent trends likely reflect source material bias rather than genuine historical patterns
TL;DR
A 2005 paper by Huebner claimed worldwide innovation was declining—particularly after 1850. It was frequently cited to support theories about IQ dysgenics, but appears to be flawed.
By analyzing the same historical text Huebner used but counting notable figures instead of innovations, no significant decline was found.
When comparing against a comprehensive database of historical figures, the data actually shows an increase in innovation-related figures over time, contradicting Huebner's findings.
The apparent decline in Huebner's study likely stems from selection bias in his source material (a single history book) rather than reflecting actual innovation trends.
Introduction
During the late 2010s and early 2020s, IQ dysgenics theory gained considerable attention within certain academic and online communities. Michael Woodley had steadily published research on estimating IQ dysgenics using Galton's methods, while Edward Dutton promoted these ideas through his YouTube channel and co-authored work "At Our Wits' End: Why We're Becoming Less Intelligent and What It Means for the Future". The prevailing narrative suggested that individuals with lower cognitive abilities reproduced at higher rates and earlier ages than their more intelligent counterparts. Given the established heritability of IQ, proponents argued that humanity faced inevitable intellectual decline—with the satirical film Idiocracy serving as an unintended prophecy.
However, subsequent research has substantially revised this narrative. New evidence published over recent years, combined with the reduced prominence of key advocates in academic discourse, has led to a more nuanced understanding of these phenomena. Recent comprehensive analysis by HBD researchers has revealed two critical findings:
First, IQ dysgenics effects are considerably smaller than initially proposed. When IQ is measured directly in dysgenics calculations—rather than using proxies like educational attainment—the effects, while statistically significant, are modest in magnitude.
Second, selection pressures against educational attainment exceed those against IQ itself. Since educational attainment frequently served as a proxy for IQ in genetic and biobank studies, previous estimates of cognitive decline were substantially inflated.
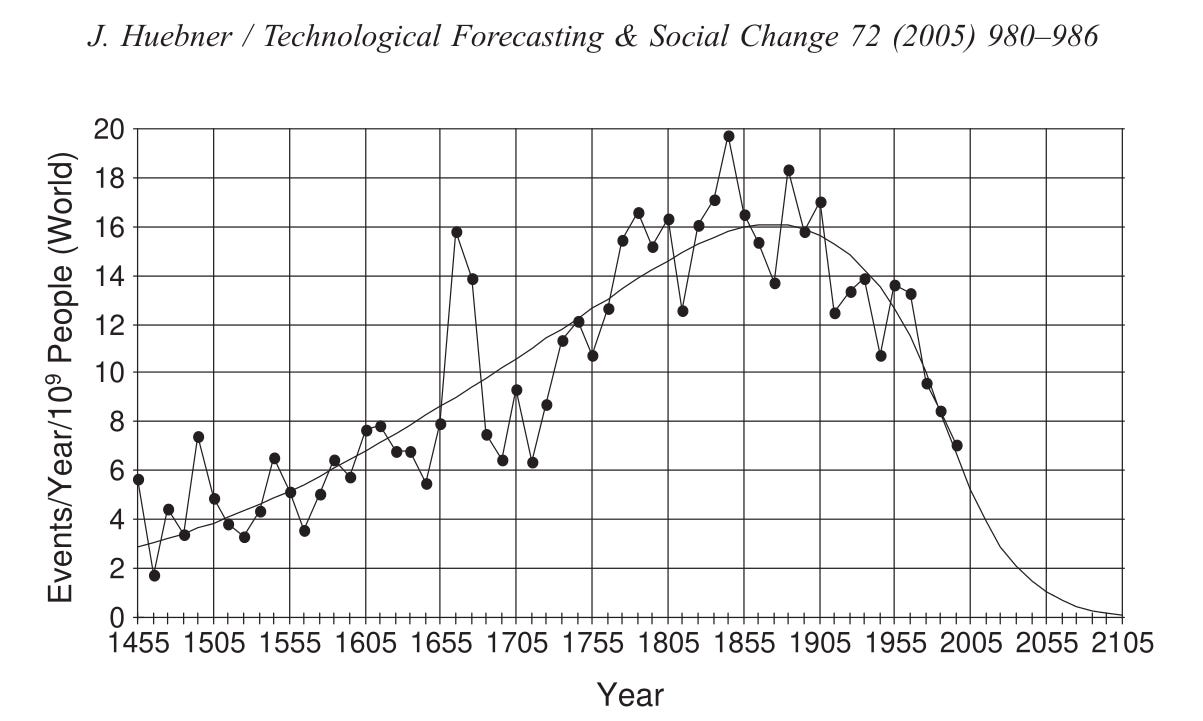
During the peak of dysgenics discourse, this supposed cognitive decline provided explanatory frameworks for various societal trends. Innovation represented a particularly compelling case study: proponents argued that declining innovation rates directly reflected population-level IQ dysgenics. The cornerstone evidence for this argument came from Huebner's 'A Possible Declining Trend for Worldwide Innovation', which produced the influential and frequently cited (152 times) figure:
This finding aligned seamlessly with dysgenics theory, which posited that cognitive decline began when natural selection pressures against lower IQ relaxed—presumably during the post-industrial period. The year 1850 represented an ideal inflection point for this narrative.
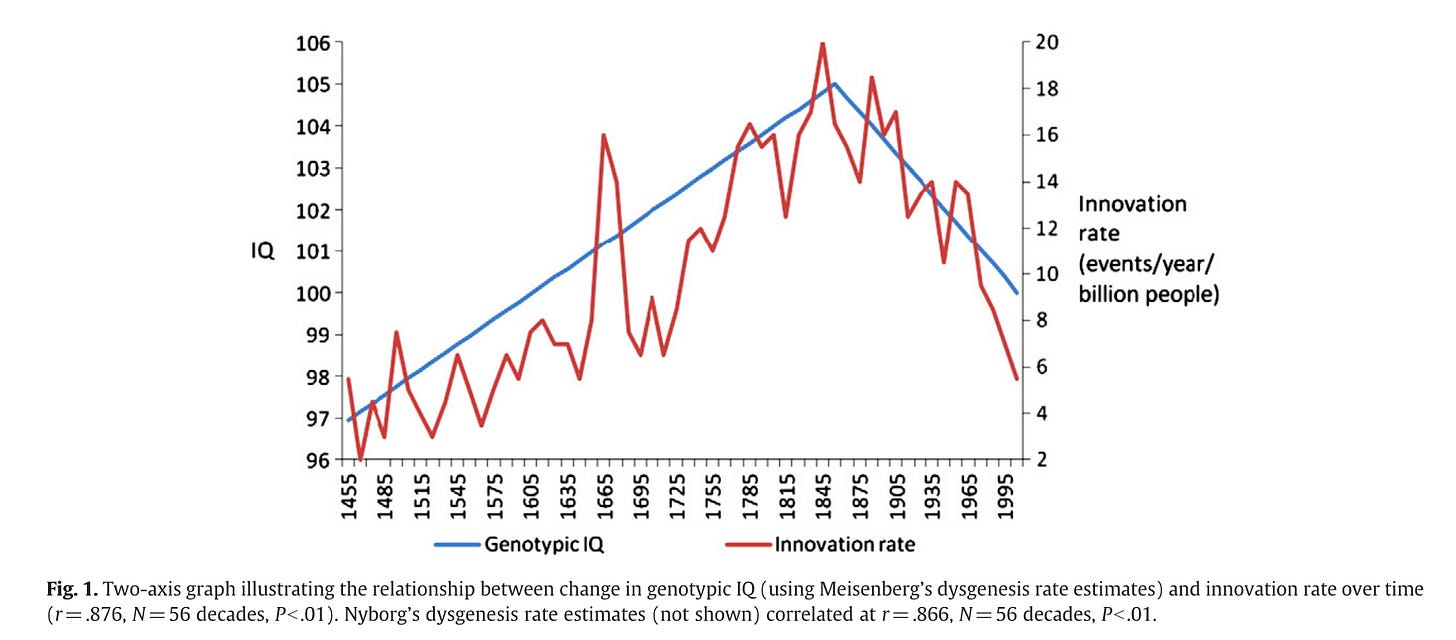
The apparent strength of this correlation prompted Michael Woodley to publish additional research exploring this relationship (cited 62 times). He reported a remarkably strong correlation of r = .876 across 56 decades of data:
However, this correlation appears problematic when viewed through the lens of current understanding and may represent circular reasoning rather than genuine causal relationships. The logical circularity operates as follows: IQ dysgenics theory predicts that cognitive decline should manifest as innovation decline; Huebner's paper appears to document innovation decline; this decline is then cited as evidence supporting IQ dysgenics theory. Yet if Huebner's innovation decline stems from methodological artifacts rather than genuine historical trends—as this analysis suggests—then using his findings to validate dysgenics theory constitutes circular reasoning. The correlation becomes spurious: researchers identified a dataset that appeared to confirm their theoretical predictions, but the dataset itself may reflect selection bias rather than the phenomenon it purports to measure.
Nevertheless, the central question remains: could Huebner's 2005 paper genuinely document innovation decline independent of IQ dysgenics theory? This analysis addresses this possibility by examining whether the sources underlying Huebner's conclusions suffer from systematic selection bias.
Methodology: Replicating and Extending Huebner's Approach
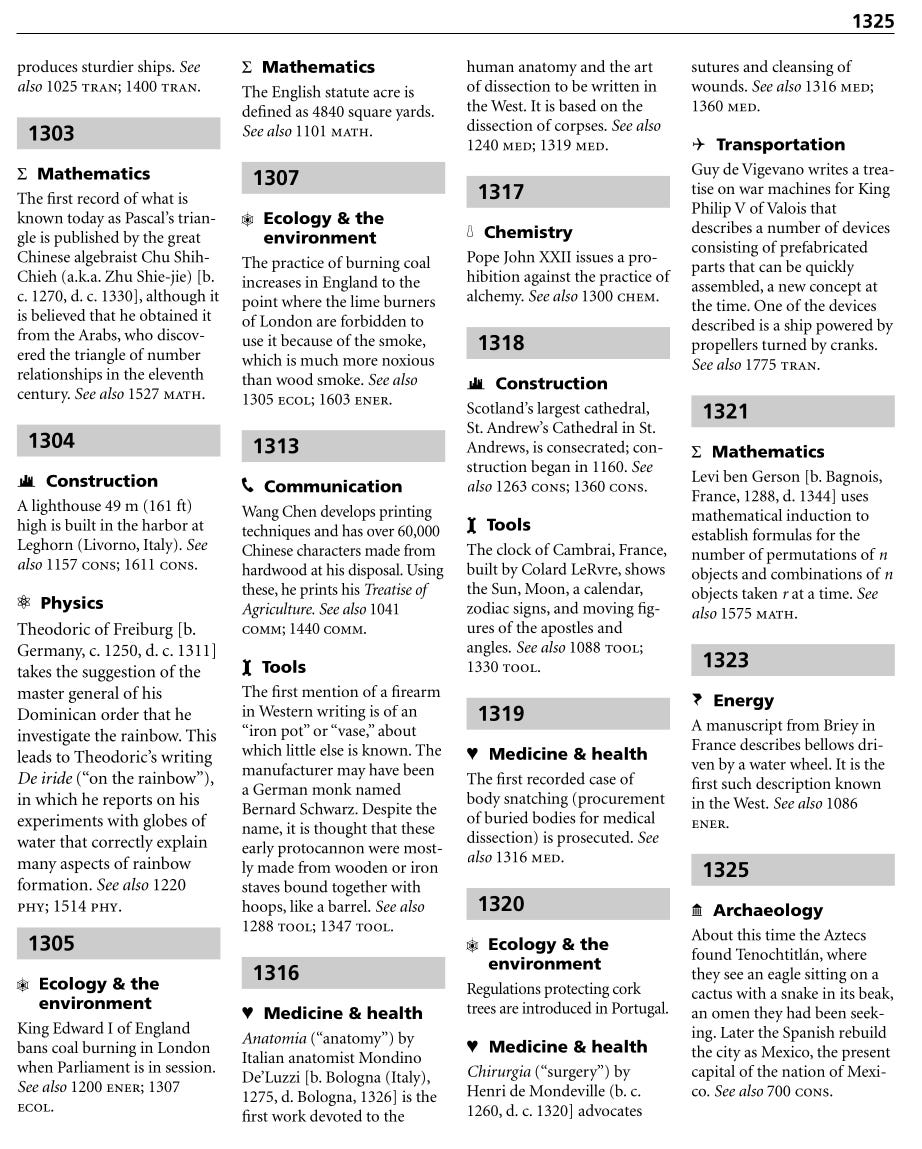
Huebner derived his innovation data from 'The History of Science and Technology' by Bryan Bunch, a chronologically organized reference work spanning from 3000 BC to 2003 AD. The book employs a systematic format where years appear in page headers or footers, with multiple innovation events on single pages distinguished by clearly marked temporal divisions.
Rather than replicating Huebner's innovation counting approach, this analysis focuses on the historical figures mentioned in the same source material. This methodological shift enables examination of whether apparent innovation decline reflects genuine historical trends or artifacts of the source material's scope and selection criteria.
Data Processing Framework
The analysis employed Natural Language Processing (NLP) techniques to systematically extract and analyze historical figures from Bunch's text:
Extract complete text from all pages
Apply regular expressions to identify year references for each page
Use NLP algorithms to distinguish personal names from common nouns
Construct a comprehensive database linking page numbers, text content, temporal references, and identified names
To transform raw name extraction into a robust historical dataset, several refinement steps were necessary:
Calculate temporal associations by averaging the years associated with each distinct name across the entire book
Integrate findings with the cross-verified database of notable people, 3500BC-2018AD, which encompasses all figures documented in Wikipedia and Wikidata—providing a far more extensive historical record. The database was filtered to exclude contemporary celebrities and athletes
Apply Levenshtein distance algorithms to match names from Bunch's text with entries in the cross-verified database, optimizing matches based on temporal proximity between book references and documented lifespans
This process identified approximately 6,000 historical figures mentioned in Bunch's work between 1450 and 2003. While the matching algorithm achieved high accuracy for most entries, some matches involved figures with variant spellings or slight temporal discrepancies. The overall correlation between extracted names and verified historical figures was sufficiently robust for analytical purposes.
The cross-verified database integration served two essential functions: it provided occupational classifications for figures mentioned in Huebner's source material, and it supplied precise birth and death dates for temporal analysis. This enhanced dataset enabled systematic examination of several critical hypotheses.
Research Questions
This analysis addresses four key questions regarding potential biases in Huebner's source material:
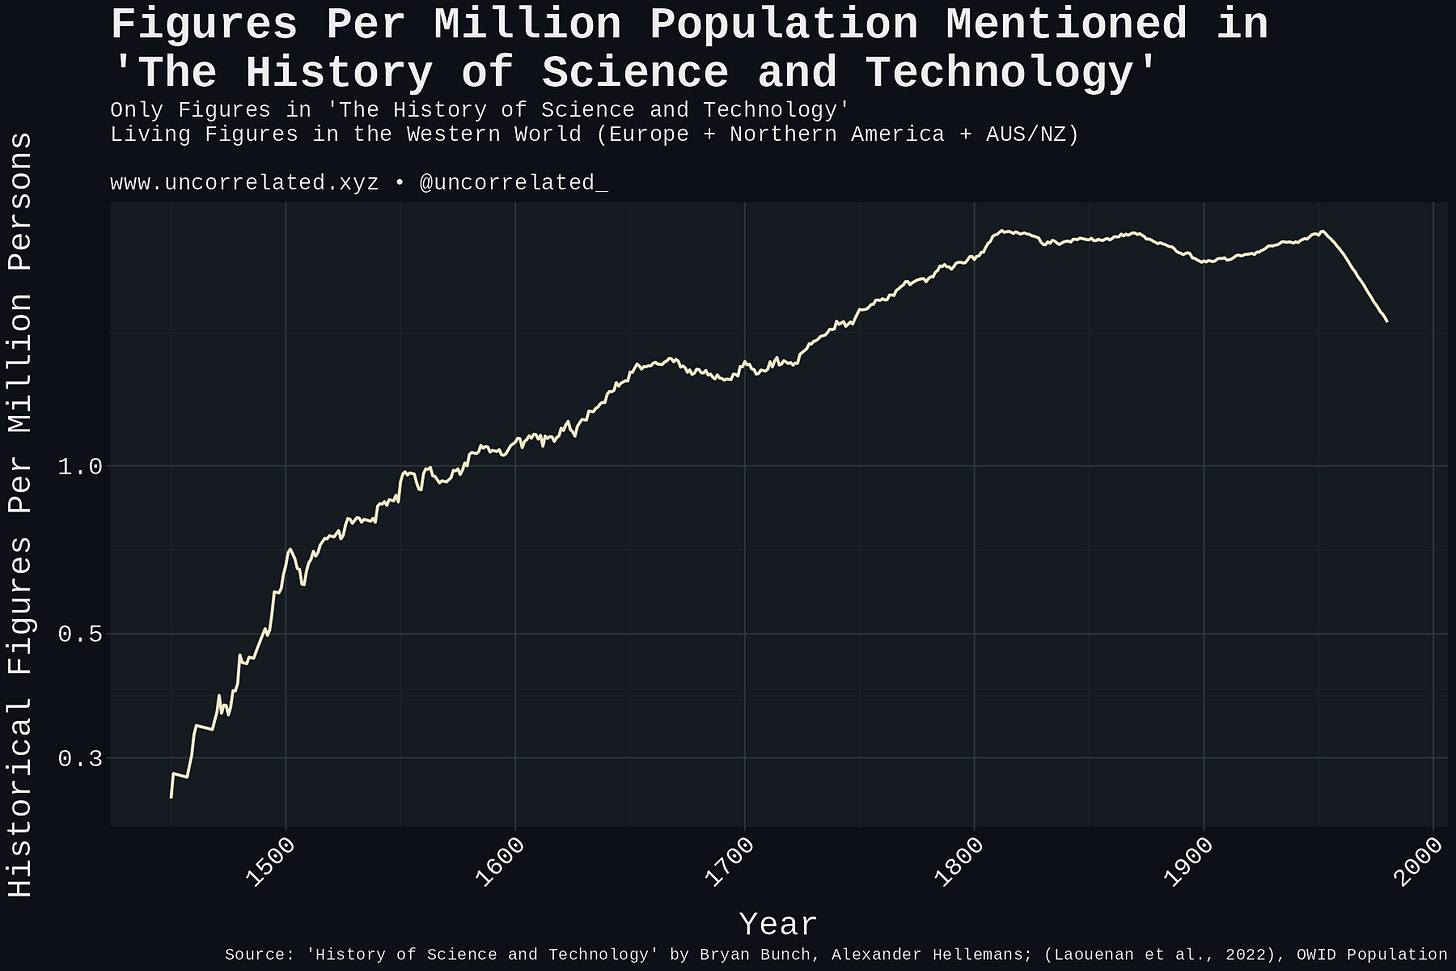
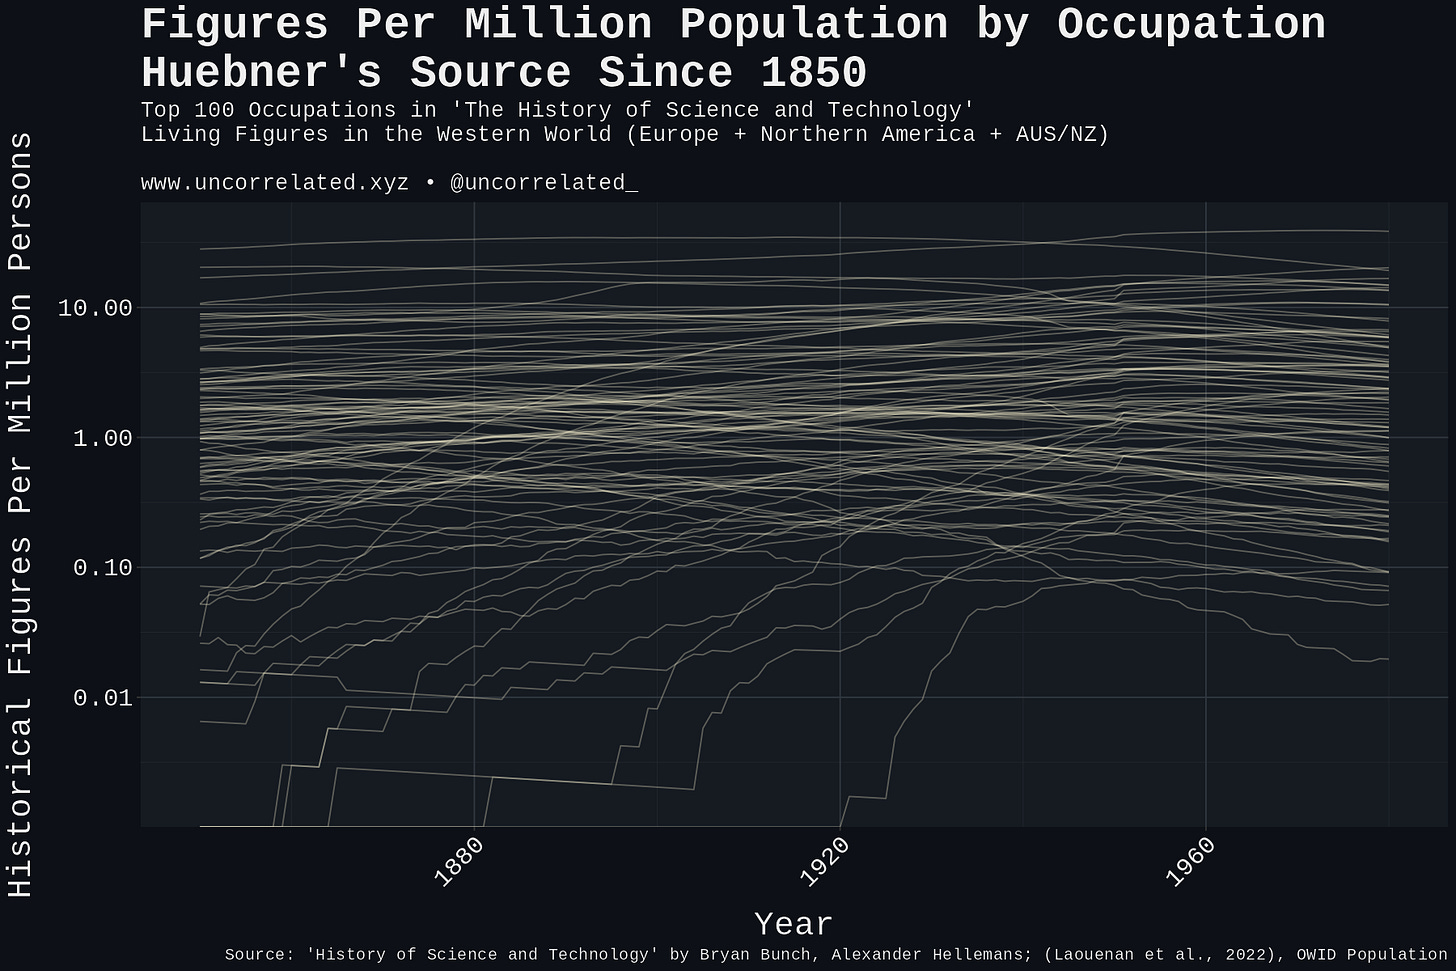
Does 'The History of Science and Technology' exhibit declining mentions of historical figures per capita, paralleling Huebner's innovation decline findings?
If per capita mentions of innovators declined alongside innovations, this would support Huebner's conclusions, since innovation requires innovators.
When examining only occupations represented in Huebner's source, do these same occupations show decline in the comprehensive cross-verified database?
This test reveals whether 'The History of Science and Technology' systematically samples from declining occupational categories while neglecting emerging fields.
Does the cross-verified database demonstrate decline among the most eminent figures (top 0.1%), and do such patterns correlate with trends in Huebner's source?
This addresses whether observed patterns result from the source material's focus on exceptionally prominent figures, or whether the comprehensive database oversamples recent, less historically significant individuals.
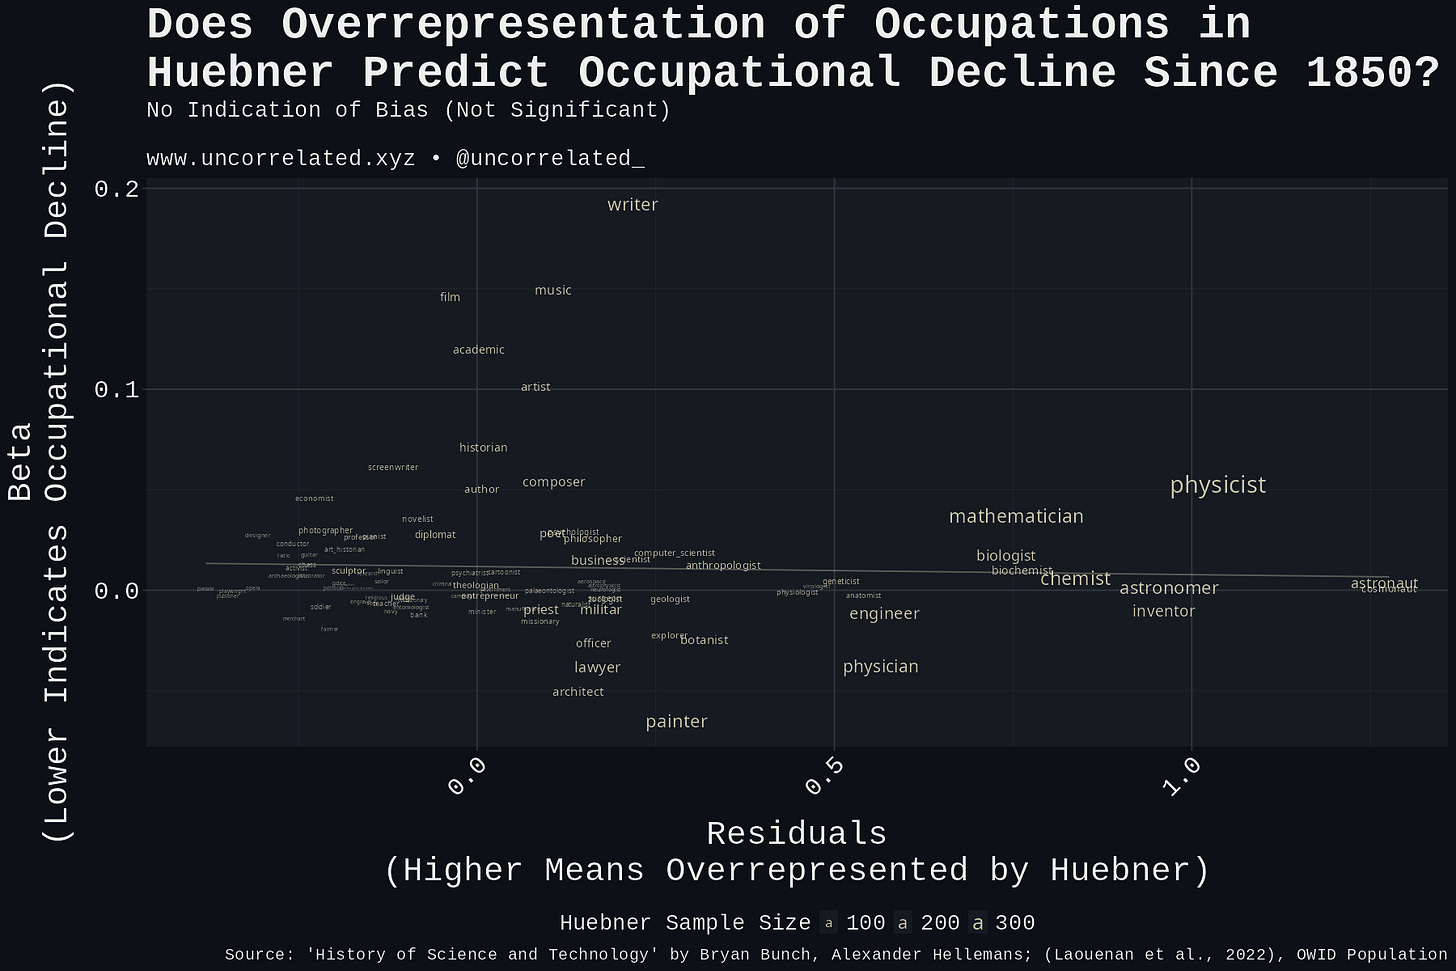
Do occupations overrepresented in 'The History of Science and Technology' correlate with declining trends in the broader historical record?
Positive correlation would indicate systematic bias toward occupations experiencing historical decline.
Results
Historical Figures Per Capita in Huebner's Source
Analysis reveals no significant decline in living historical figures per capita within 'The History of Science and Technology' comparable to Huebner's reported innovation decline. The data shows relatively stable or slightly increasing trends rather than the dramatic post-1850 decline that characterized Huebner's innovation metric.
Occupation-Specific Trends in Comprehensive Database
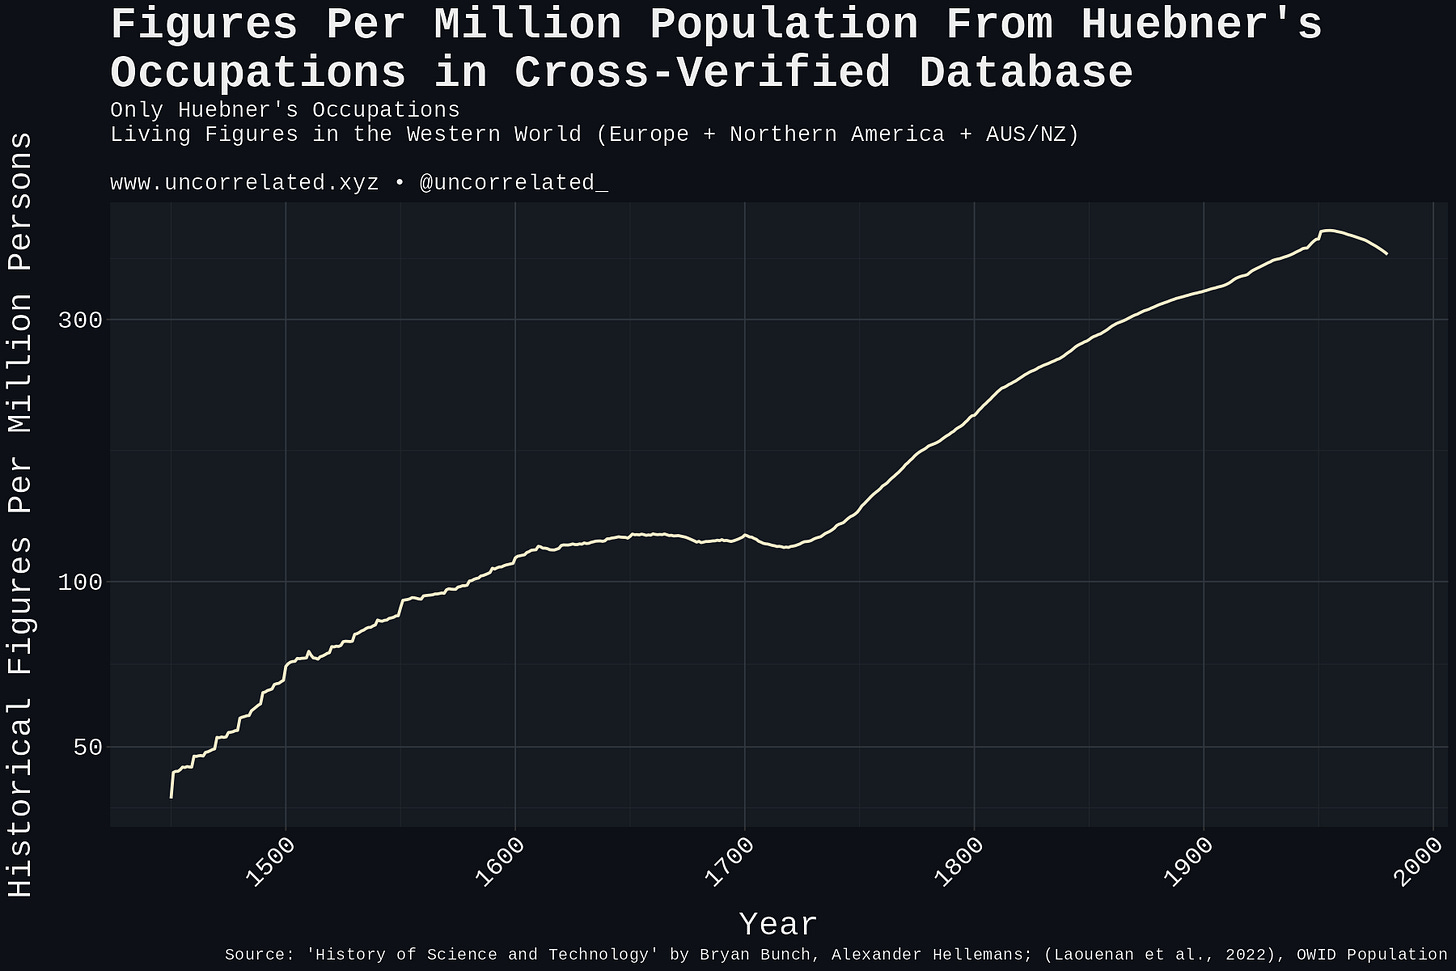
Examination of the comprehensive cross-verified database yields results directly contradicting expectations of decline. When filtering for occupations represented in Huebner's source material, the data reveals substantial increases rather than decreases over time. This finding suggests that apparent plateaus in 'The History of Science and Technology' result from incomplete sampling rather than genuine historical trends.
Elite Figure Analysis
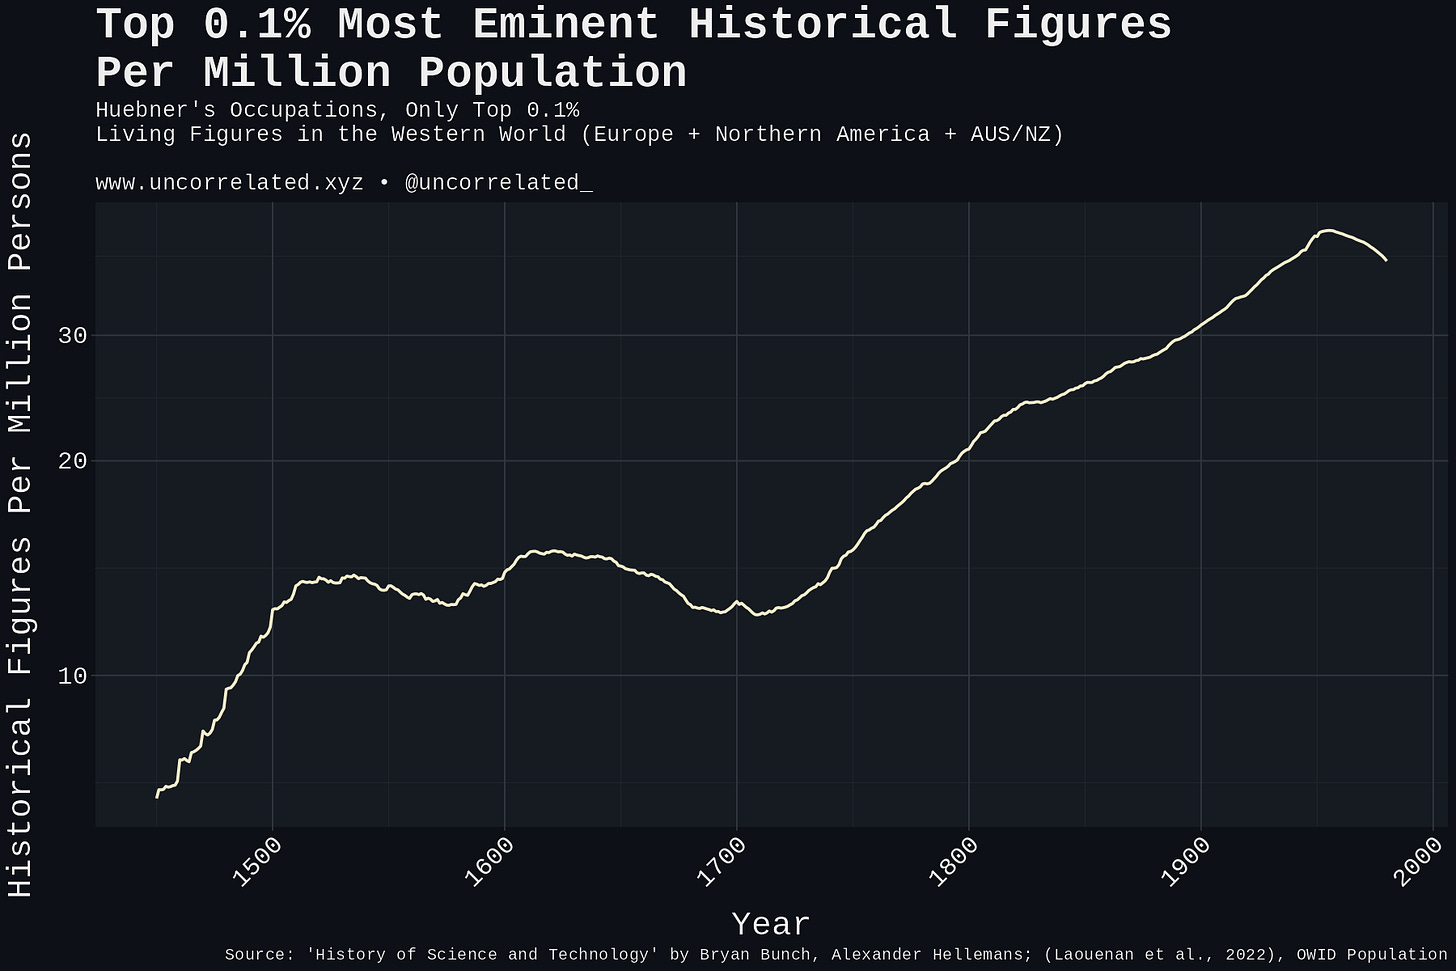
Analysis of the top 0.1% most eminent figures in the cross-verified database closely mirrors the broader occupational trends, effectively eliminating concerns that observed increases result from oversampling less significant recent figures. The consistency between elite and general population trends strengthens confidence in the underlying data quality.
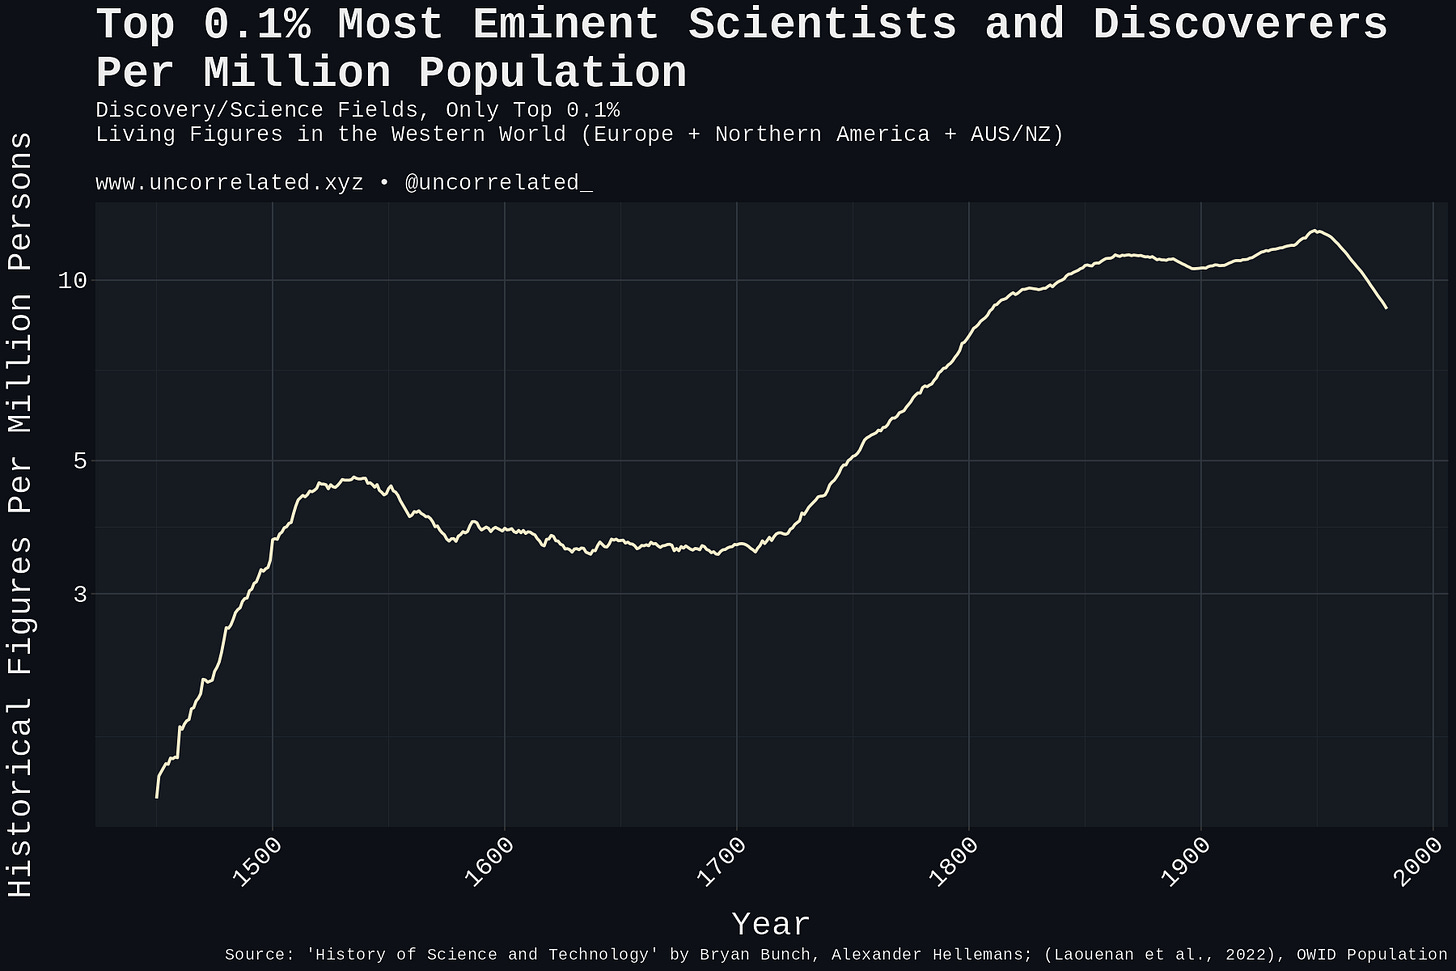
Furthermore, when filtering the elite figures specifically for those in Discovery/Science fields—the categories most relevant to innovation—the same increasing pattern emerges, directly contradicting Huebner's decline narrative for the most accomplished scientists and discoverers.
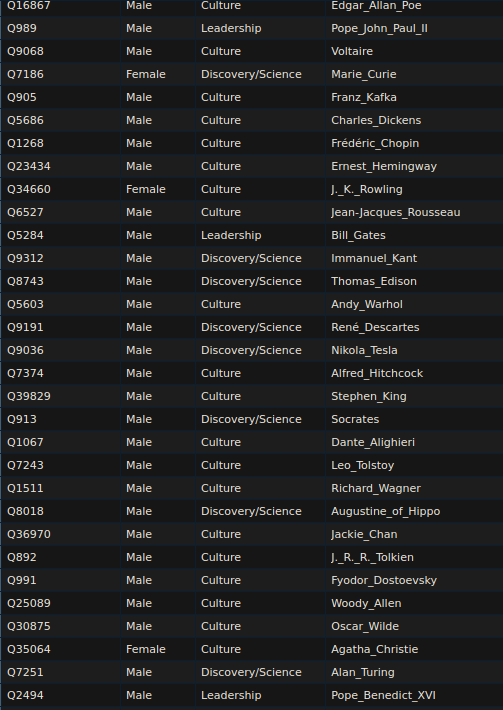
The eminence of these top-tier figures is readily apparent from their universal recognition:
Occupation Bias Analysis
Systematic examination of the 100 most frequently mentioned occupations in 'The History of Science and Technology' reveals no correlation between their representation in Bunch's work and their historical trajectory in the comprehensive database. This finding rules out the possibility that the source material inadvertently focuses on occupations experiencing genuine historical decline.
Discussion and Conclusions
This comprehensive analysis demonstrates the absence of declining trends in eminent historical figures across both Huebner's source material and the larger cross-verified database. The stability of figure mentions in Bunch's work, contrasted with clear increases in the comprehensive database, cannot be attributed to occupational bias or selective focus on elite individuals.
These findings suggest that Huebner's reported innovation decline likely reflects the inherent limitations of his source material. Bunch's 'The History of Science and Technology,' while representing a substantial scholarly effort at 785 pages, contains a sample size approximately 100 times smaller than the cross-verified database. Comprehensive representation of historical innovations proportional to the actual number of innovators would require a reference work of several thousand pages—an impractical undertaking for any editorial team.
The nature of innovation itself has undergone fundamental transformation since Huebner's analysis. Traditional occupational categories like 'inventor'—frequently sampled in Bunch's work—have indeed declined, but this reflects structural changes in how innovation occurs rather than absolute innovation decline. Contemporary innovation manifests through incremental improvements following predictable trajectories, exemplified by exponential cost reductions in technologies like batteries that follow Moore's Law-like patterns. Modern innovation operates through accumulated marginal gains rather than the dramatic singular breakthroughs that characterized earlier eras and dominated historical narratives.
Additionally, current understanding of dysgenics effects as modest rather than catastrophic undermines theoretical foundations for expecting per capita innovation decline. Without substantial population-level cognitive decline, arguments for innovation decline based on human capital deterioration lack empirical support.
The convergence of methodological limitations in Huebner's source material, evolving patterns of innovation, and revised understanding of cognitive trends provides substantial evidence for reconsidering his conclusions. Two decades of subsequent research have developed far more sophisticated approaches to measuring innovation across multiple dimensions, rendering single-source historical analyses increasingly obsolete.
This analysis supports a verdict of substantial doubt regarding Huebner's innovation decline thesis, suggesting that his findings reflect sampling artifacts rather than genuine historical trends.
Bunch, B., & Hellemans, A. (2004). The history of science and technology: A browser's guide to the great discoveries, inventions, and the people who made them from the dawn of time to today. Houghton Mifflin Harcourt.
Dutton, E., & Woodley of Menie, M. A. (2018). At our wits' end: Why we're becoming less intelligent and what it means for the future. Imprint Academic.
Huebner, J. (2005). A possible declining trend for worldwide innovation. Technological Forecasting and Social Change, 72. https://doi.org/10.1016/j.techfore.2005.01.003
Jensen, S. (2024, January 30). Are we getting dumber? Data on IQ and fertility across the world. Center for the Study of Partisanship and Ideology. https://www.cspicenter.com/p/are-we-getting-dumber
Laouenan, M., Bhargava, P., Eyméoud, J. B., Gergaud, O., Plique, G., & Wasmer, E. (2022). A cross-verified database of notable people, 3500BC-2018AD. Scientific Data, 9(1), 290. https://doi.org/10.1038/s41597-022-01369-4
Woodley of Menie, M. (2012). The social and scientific temporal correlates of genotypic intelligence and the Flynn effect. Intelligence, 40, 189-204. https://doi.org/10.1016/j.intell.2011.12.002

Good article, though Dutton at least differentiated between incremental innovation versus larger innovation (I forget the term). The former being of course quite strong in modern times, but the latter appears to have decreased
Great article, looking forward to the next ones!